Lightweight What?
In Postgres, lightweight locks, or lwlocks, control access to datastructures in shared memory. Unlike table or row locks, lightweight locks are usually held for a very short time and are not bound to the ongoing transaction. As a database client, you don’t have direct control over when these locks are acquired. They operate under the hood and are managed by Postgres itself.
This post is going to explore Postgres’ lock manager, lwlocks, fast-path locking and how to combat LWLock:LockManager wait events.
LWLocks and the Lock Manager
Whenever you interact with a relation (a table or an index) in Postgres, the system acquires a lock on it. These locks are often referred to as heavyweight locks. It might seem counter-intuitive, but even read queries acquire locks that Postgres needs to keep track of.
To accelerate lock acquisition, Postgres uses a mechanism called fast-path locking.
This technique is used in scenarios where “weak” relation locks are used (AccessShareLock, RowShareLock, or RowExclusiveLock) and only when the system can quickly verify that no conflicting locks could possibly be
present.
Each transaction is allowed to take 16 fast-path locks.
/*
 * We allow a small number of "weak" relation locks (AccessShareLock,
 * RowShareLock, RowExclusiveLock) to be recorded in the PGPROC structure
 * rather than the main lock table.  This eases contention on the lock
 * manager LWLocks.  See storage/lmgr/README for additional details.
 */
#define		FP_LOCK_SLOTS_PER_BACKEND 16
Once the limit is exceeded, further lock acquisitions have to go through the lock manager. Depending on the type of workload, this can create lock acquisition contention and slow down your workload.
Let’s See Fast-Path in Action
To better understand fast-path, it helps to go through the motions and see it for yourself.
The pg_locks view shows information about locks held by active processes.
The column fastpath will be set to true when the lock was taken via fast path.
Let’s perform the following experiment.
In one database session, we’re going to start a transaction and then perform multiple select queries on different tables.
This way, we’re going to acquire a lock on each relation.
At the same time, let’s open up another database session and let’s observe the pg_locks table.
Start a new transaction and perform select statements. For this scenario, I’ve created multiple empty tables.
begin;
select * from test1;
In the second database session, view pg_locks;
select relation::regclass, locktype, pid, mode, fastpath
from pg_locks
where pid != pg_backend_pid(); -- filter out the locks acquired by this query
Pid 51 is the backend process from the first database session.
We can see two locks.
The AccessShareLock is acquired by the select statement on the test1 table.
The ExclusiveLock, on the other hand, is a lock on the virtual transaction ID.
 relation |  locktype  | pid |      mode       | fastpath
----------+------------+-----+-----------------+----------
 test1    | relation   |  51 | AccessShareLock | t
          | virtualxid |  51 | ExclusiveLock   | t
(2 rows)
In the first database session, if we continue to perform additional select statements on relations we haven’t touched yet, we can see that the amount of locks acquired by pid 51 is going to grow.
-- in the first database session
select * from test2;
 relation |  locktype  | pid |      mode       | fastpath
----------+------------+-----+-----------------+----------
 test2    | relation   |  51 | AccessShareLock | t
 test1    | relation   |  51 | AccessShareLock | t
          | virtualxid |  51 | ExclusiveLock   | t
(3 rows)
Fast path doesn’t apply only to select statements.
We can also INSERT, UPDATE and DELETE.
-- in the first database session
insert into test1 (id, value) values (1, 'hello');
update test2 set value = 'hello';
Now we can see that two more relation locks have appeared.
The RowExclusiveLocks are acquired when inserting, updating or when performing deletes.
 relation |   locktype    | pid |       mode       | fastpath
----------+---------------+-----+------------------+----------
 test2    | relation      |  51 | AccessShareLock  | t
 test2    | relation      |  51 | RowExclusiveLock | t
 test1    | relation      |  51 | AccessShareLock  | t
 test1    | relation      |  51 | RowExclusiveLock | t
          | virtualxid    |  51 | ExclusiveLock    | t
          | transactionid |  51 | ExclusiveLock    | f
(6 rows)
Up to this point, all the operations have acquired fast path locks.
If we continue to acquire new locks on relations, we will eventually hit the limit of 16 fast-path locks per transaction.
Once the limit has been exceeded, the fastpath column will be set to false for any new lock.
Therefore, new lock acquisitions have to go through the lock manager.
 relation |   locktype    | pid |       mode       | fastpath
----------+---------------+-----+------------------+----------
...
 test17   | relation      |  51 | AccessShareLock  | f
(21 rows)
A Plethora of Indices
In the previous example, we focused on operations involving individual tables without any indexes. However, in real-world scenarios, indexes play a critical role in everyday queries. As a result, locks must be acquired on indexes as well. To demonstrate this, let’s create a table with multiple indexes.
create table many_indexes(
  id bigserial primary key,
  a char(100),
  b char(100),
  c char(100),
  d char(100),
  e char(100),
  f char(100),
  g char(100),
  h char(100),
  i char(100),
  j char(100),
  k char(100),
  l char(100),
  m char(100),
  n char(100),
  o char(100),
  p char(100),
  q char(100)
);
Imagine that every column in this table is indexed. Let’s perform a select on the table and see which locks get acquired.
begin;
select * from many_indexes;

-- in another db session, let's run
select relation::regclass, locktype, pid, mode, fastpath
from pg_locks
where pid != pg_backend_pid();
     relation      |  locktype  | pid |      mode       | fastpath
-------------------+------------+-----+-----------------+----------
 n_idx             | relation   |  51 | AccessShareLock | t
 m_idx             | relation   |  51 | AccessShareLock | t
 l_idx             | relation   |  51 | AccessShareLock | t
 k_idx             | relation   |  51 | AccessShareLock | t
 j_idx             | relation   |  51 | AccessShareLock | t
 i_idx             | relation   |  51 | AccessShareLock | t
 h_idx             | relation   |  51 | AccessShareLock | t
 g_idx             | relation   |  51 | AccessShareLock | t
 f_idx             | relation   |  51 | AccessShareLock | t
 e_idx             | relation   |  51 | AccessShareLock | t
 d_idx             | relation   |  51 | AccessShareLock | t
 c_idx             | relation   |  51 | AccessShareLock | t
 b_idx             | relation   |  51 | AccessShareLock | t
 a_idx             | relation   |  51 | AccessShareLock | t
 many_indexes_pkey | relation   |  51 | AccessShareLock | t
 many_indexes      | relation   |  51 | AccessShareLock | t
                   | virtualxid |  51 | ExclusiveLock   | t
 p_idx             | relation   |  51 | AccessShareLock | f
 o_idx             | relation   |  51 | AccessShareLock | f
 q_idx             | relation   |  51 | AccessShareLock | f
(20 rows)
In addition to the table itself, AccessShareLock is acquired on all indexes.
Notice that for a couple of indexes, fastpath is set to false.
With a query on a single table with a lot of indexes, we were able to reach the limit of 16 fast-path locks per transaction.
So far, we’ve focused on selecting individual tables and observed that indexes also count toward the fast-path lock limit. However, in relational databases, a common access pattern involves joining multiple tables. During a join operation, locks are acquired on every relation involved—this includes all tables and their associated indexes.
LockManager
When fast-path cannot be used, locks need to be recorded in a shared memory hash table. In Postgres, the hash table is divided into 16 partitions.
/* Number of partitions the shared lock tables are divided into */
#define LOG2_NUM_LOCK_PARTITIONS  4
#define NUM_LOCK_PARTITIONS  (1 << LOG2_NUM_LOCK_PARTITIONS)
This allows for greater concurrency. Only the partition where the acquired lock falls into needs to be locked and not the entire hash table.

However, in high traffic databases with frequent non-fast-path lock acquisitions, even the 16 partitions can become a bottleneck.
This is exactly what the LWLock:LockManager wait event indicates: a process is attempting to access a partition in the shared hash table but cannot proceed because the partition is already locked.
Summon LWLock:LockManager Wait Event
Now that we have a basic overview of the lock manager and fast-path locking, let’s perform another experiment.
Let’s create a scenario where we can see LWLock:LockManager wait events in action.
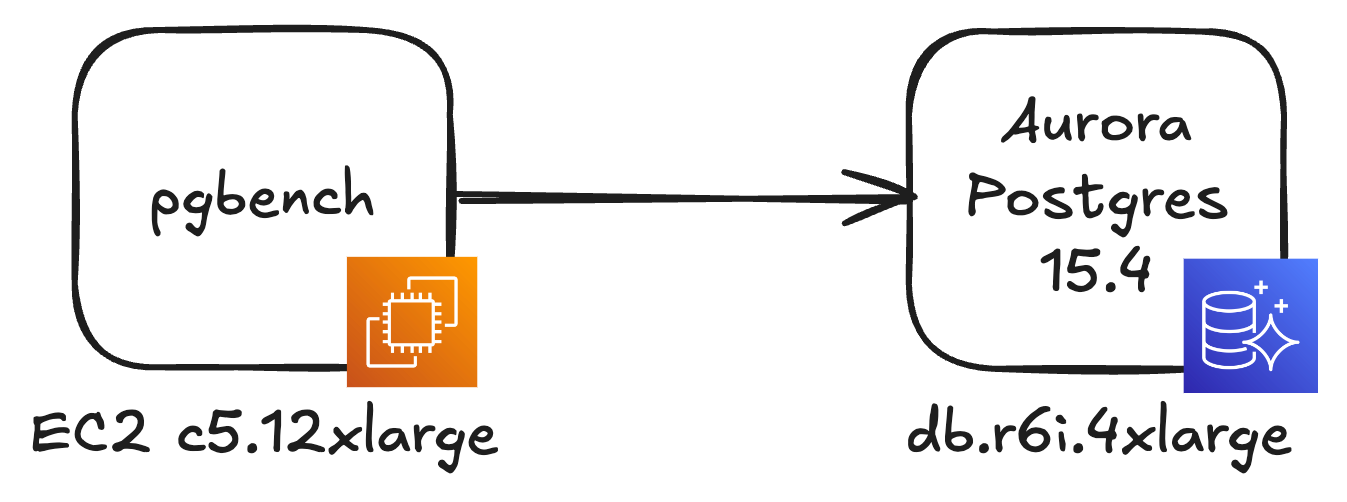
For this scenario, I’ve created an Aurora Postgres 15 instance and an EC2 instance that’s acting as a database client.
I used fairly large instance sizes (c5.12xlarge for the EC2 instance and db.r6i.4xlarge for Aurora Postgres).
My goal is to run many concurrent threads and process a large amount of database queries in parallel.
Since LWLock:LockManager wait event is a sign of lock manager contention, I’m hoping that a high amount of parallelism makes it easier to reproduce the issue.

The database contains 20 tables, appropriately named test1, test2, and so on up to test20.
For the purposes of this test, the table schema is not important.
All tables are empty.
We’re going to use pgbench to run the following SQL script.
begin;
select * from test1;
select * from test2;
...
select * from test20;
commit;
It performs a transaction during which all tables get selected. We learned previously that we have 16 fast-path locks per transaction. Acquiring more than 16 locks should cause a situation where some locks have to be acquired via the lock manager.
During the test, pgbench will run for 240 seconds, creating 40 threads and 800 database connections. These threads will repeatedly run the SQL script, simulating a high-concurrency workload.
pgbench -f test.sql -T 240 -c 800 -j 40 -U postgres \
  -h database-2-instance-1.cky0tsfnwec5.eu-central-1.rds.amazonaws.com postgres
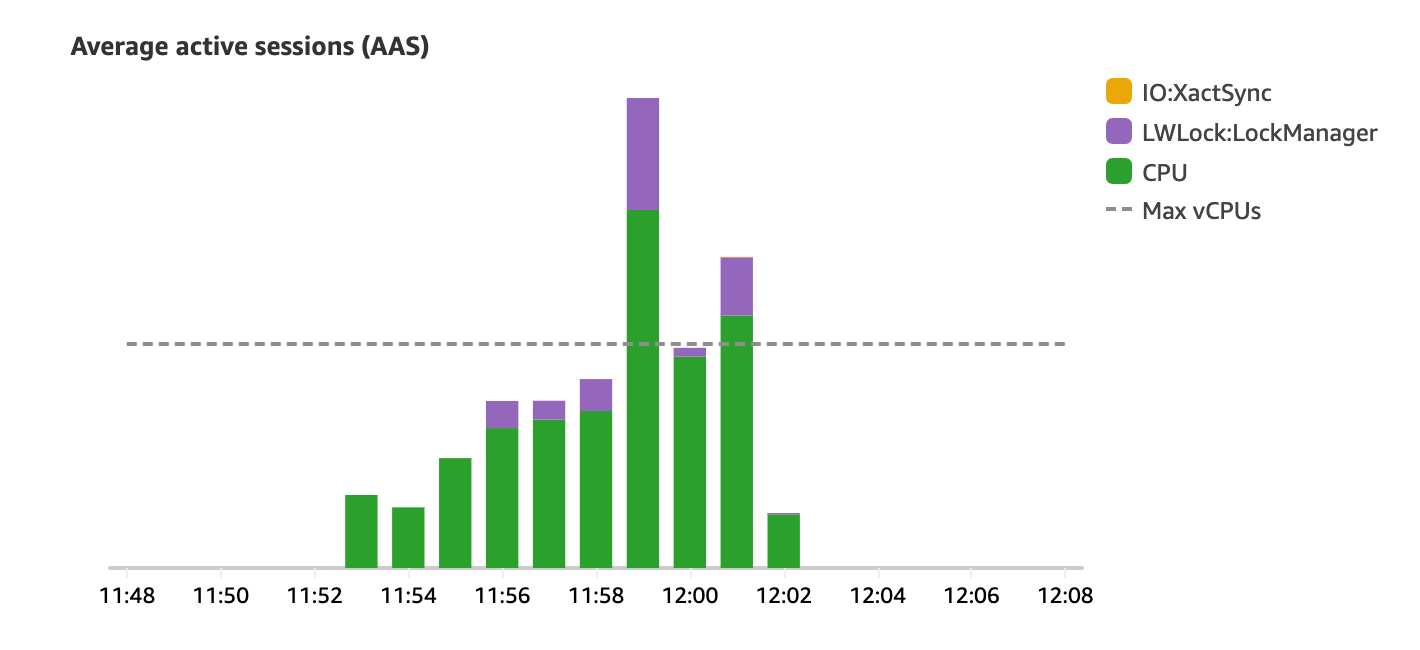
Looking at RDS Performance Insights after the experiment, we can clearly see the presence of LWLock:LockManager wait events.

To make sure our understanding of fast-path locking and lock manager is correct, let’s reduce the number of select statements in the test script to below 16.
begin;
select * from test1;
select * from test2;
...
select * from test14;
commit;
This should ensures that fast-path locking is always used.
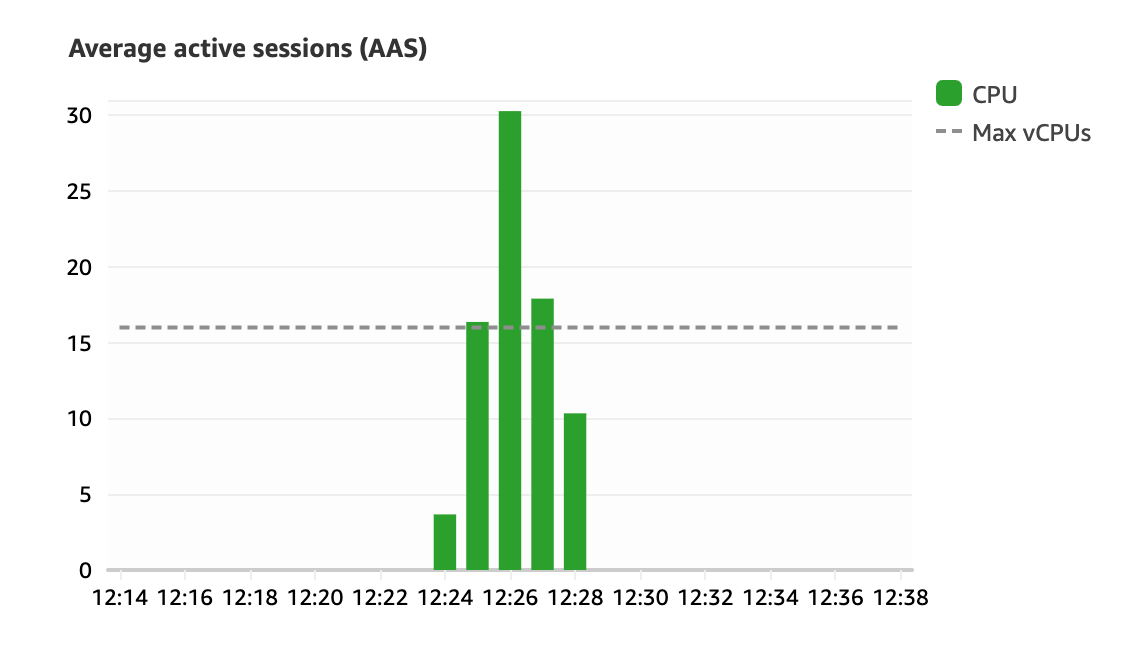
When rerunning the test, my expectation is that LWLock:LockManager wait events should disappear because lock manager isn’t used anymore to keep track of lock acquisitions.

As expected, LWLock:LockManager wait events have disappeared.
How Might This Happen in Production Systems
If your application suddenly experiences LWLock:LockManager wait events that slow it down, it’s a good idea to review recent changes in the application code.
Perhaps a frequently executed code path has been modified, causing it to acquire a additional locks.
While a few extra locks might not sound dangerous at first, if a frequently executed transaction starts to acquire more non-fast-path locks, this could put pressure on the lock manager and create contention.
A common strategy in Postgres is to partition a large table by time periods.
For instance, an orders table might be divided into monthly segments.
A partition in Postgres is essentially a separate table with its own indexes.
As a result, queries that have to scan multiple partitions are also going to acquire more locks and this can lead to LockManager wait events.
LockManager wait events can also be triggered by a sudden surge in traffic. An application might have a steady baseline of non-fast-path lock acquisitions that don’t cause any problems. But when the incoming traffic increases, LockManager can suddenly reach a limit and noticeable wait events start to appear.
How to Deal With LockManager Wait Events?
There’s no one-size-fits-all solution, as every workload is unique. However, here are some strategies to consider:
- Manage transaction scope: As applications grow, the amount of work performed within a single transaction often increases. Consider whether some transactions can be simplified or reduced in scope to minimize locking contention.
- Monitor ORM behavior: Object-Relational Mapping (ORM) libraries may over-fetch data by joining multiple tables unnecessarily. Review query patterns generated by your ORM and optimize where possible.
- Optimize table partitioning: If using table partitioning, carefully manage the size and number of partitions. Ensure that your queries use the partition key to avoid scanning multiple partitions.
- Implement client-side caching: Caching query results on the client side can reduce the need for repeated database queries and lock acquisition, lowering the chances of LockManager wait events.
- Use reader instances: Distributing query load across multiple reader instances reduces the per-instance LockManager load.
- Review your indexes: Periodically review your indexes and remove any that are unused to reduce unnecessary locking overhead.

